Automated Tax Projection Features in VeriPlan

This is the text transcript of this video. It also includes the slides used in the video above. Note that this video is better when viewed in full-screen mode.

This is Larry Russell. This video summarizes automated tax projections in the VeriPlan lifetime financial planning software application. The VeriPlan lifetime financial planning software automates lifetime tax projections in a very sophisticated way.
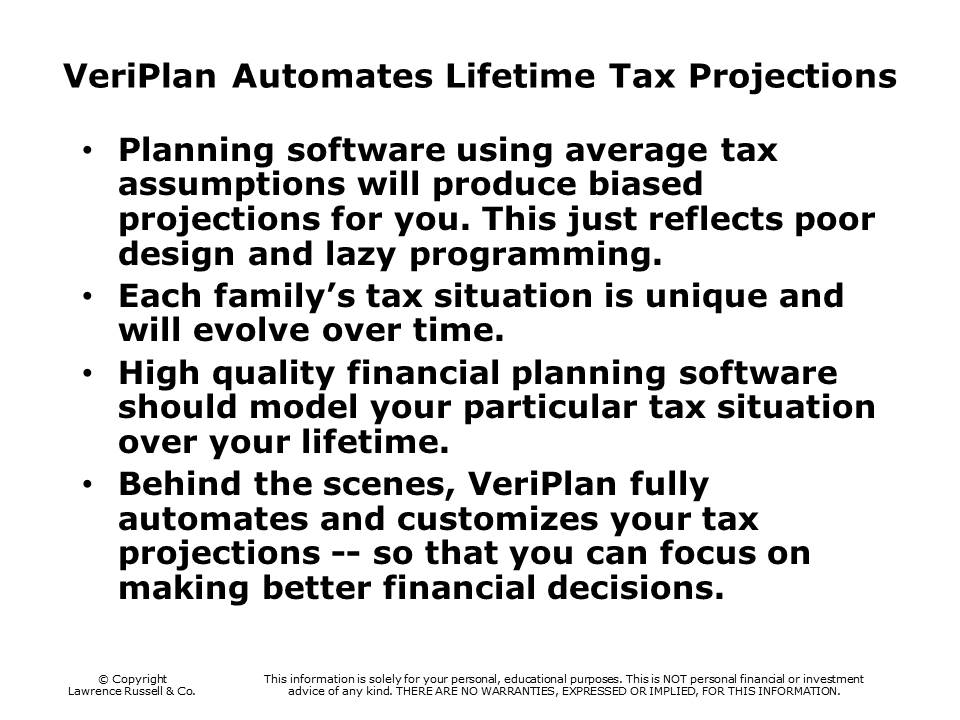
The first bullet here is just a commentary on a lot of other software packages that use average tax assumptions. They are just going to produce a biased projection for you, and frankly this just represents to me poor design and lazy programming. The real reason for this is the everybody’s tax situation is unique, and is going to evolve over time. So, if you want to actually have a decent financial projection, you need some high-quality software that is going to reflect your particular tax situation over your lifetime.
Behind the scenes, VeriPlan fully automates and customizes your tax projections. You do not run back-of-the-envelope calculations or try to construct your own spreadsheet. You can finally focus on making better financial decisions.


We are going to move very quickly now to taking a look at actually how VeriPlan works. To summarize the assumptions I have already put in there, I will go in and show you where these are done within VeriPlan. In this scenario, we will be talking about a 30-year-old married couple that lives in New York. That is New York state. If they worked in New York City they would have additional income taxes, and they could also be reflected in VeriPlan, if you wanted to.
They have a gross annual income of a $120,000. The residence is worth a half a million dollare, and they have a mortgage of a $400,000. In addition, they still have some remaining student loans of $20,000. Their ordinary living expenses are $60,000, which is about half of their gross income. Now just to understand, these living expenses do not include paying off the mortgage and other debts, and these ordinary living expenses do not include taxation or savings.
They have a portfolio at this point of about $50,000, and their asset allocation model is the ten percent cash, thirty percent bonds, and sixty percent stocks.
They intend to retire at age 67 and along the way, they intend to fully fund their IRAs and and a 401k that one of them can contribute to. When they get to retirement, they expect to have two Social Security retirement checks.

If you want to you can pause and look at the details here on this slide, you can. However, I am not going to go into these specifics, because when we flip over to VeriPlan you will actually see how these numbers are implemented specifically.
Now, I will open VeriPlan and go to the income input page. Up here I will enter a 2 is for married taxpayers. Thirty-years old is the initial age for the first earner and the second earner is also 30 years old. We also will just put in 67 as the retirement age for both.
You scroll down a little bit on this page you will see that for earner number one, he or she will have annual wage and salary income of $80,000 and the partner will have $40,000 in gross annual earnings. So, the total for the family is a $120,000.
In terms of expenses, this is the annual expenses of $60,000 entered on the Expenses worksheet. Again, these annual ordinary living expensed do not include any taxes, any debt payments, any of your savings, or any major expenditures, which in this case we have not modeled.
Moving next to the Financial Assets worksheet, there are two ways to enter your financial assets. My preference is always the very detailed method, because you can use do a lot more with it. However, if you enter a two here, you simply enter aggregate amounts for your various account types by taxability. They have $25,000 taxable accounts, and they have $25,000 in traditional tax-advantaged retirement accounts, such as IRAs and 401ks.
Here is the data entry page for different kinds of real estate, including rental real estate which is in a section below. You also enter debts here. In this first section here, you can enter your information about various homes that are owned. This column here is for their primary residence. This is the half-million dollar value. This assumption is that a real dollar terms after inflation is taken out their home will appreciate about 1% annually.
The tax basis for $450,000. Just to note here, underlying VeriPlan is a tax basis model that takes into account for all the assets you would the value that you have already paid tax on. Therefore, in your projections, you are not paying double tax on that tax basis.
Here is the mortgage debt of $400,000. We are assuming five percent interest, and this is the monthly payment on this 30-year fixed mortgage. Down here is the annual real estate taxes of $6,000. That is the assumption for annual maintenance expenses of about three thousand dollars a year.
Scroll down a little bit more, and we find the second debt section. This column is labeled student debt here. This is the $20,000 student debt with an interest rate of five percent. With a monthly payment of $377, this would be paid off in about five years.
Moving to the Taxes input worksheet, the only tax input one needs to make is just to use this pulldown menu to select a particular a state of residence from among the 50 states plus plus Washington DC. Let us just reset this pull-down menu back to New York State. We will come back to this in a second, but this is a long listing of various types of of taxation adjustments and modifications that you can make here.
Regarding retirement inputs on the Retirement worksheet, here we are putting in both of the Social Security expected payments for age 62, for full retirement age 66-67, and for age 70. Down here, we are selecting the age at which they expect to begin taking their Social Security checks.
Here on the Tax-advantaged Plans worksheet is where we can select whether or not they have an employer retirement plan that they can contribute to. In this case, only earner number one has a 401k. This is selected by using this pulldown menu. In this case this person works for a profit-making company and has access to a 401k plan.
In terms of asset allocation, on the Asset Allocation worksheet, there are a variety of methods that you can use. Here I am simply using method number three, where you can use a constant percentage allocation over time and pick whatever percentages you want. In this case, I picked ten percent for cash, thirty percent for bonds, and and sixty percent for stocks across a lifetime>
Now let us go over to VeriPlan’s projection graphics and take a look at the big picture. This graphic here is the Total Asset projection. Total assets are indicated over their lifetime starting at age 30 and this is the age timescale up to age 100. At age 100 this couple is projected to have about $3,000,000 in total asset, if they both were to live to age 100. That would mean that along the way, they fully pay all of their expenses and paid off all their debts.
The reason why this early part of the graphic drops below zero at this point reflects the deby that is pulling their total assets down. Over time this rises as the debt is paid off.
Now let us go and take a look at the Personal Taxes output graphic. This is the graphic that shows how much taxes over time they are going to pay. This first part is their working life time here. These lower taxes in the middle part reflect the fact that they stop working at 67 and some of their retirement income, such as the one of the social security checks, does not start until age 70. This is the point at which required minimum distributions must be taken out and tax from retirement plans must be paid.
These are the various tax categories that that their plan is automatically calculating and projecting for them. This is the federal income taxes and these are state and local income taxes. These are Social Security payroll taxes being taken or FICA, and the other component of FICA is the Medicare taxes. By the way just so you know, if you are self employed, VeriPlan handles both the employer and the employee side of Medicare taxes and Social Security payroll taxes.
This area here represents the residential mortgage and real estate taxes. Up here what you see is this is the same federal income taxes. This is again the real estate taxes that they obviously there even when you are no longer working. However, there are no taxes taken out for Social Security and Medicare. The required minimum distribution which have taxes taken out related to retirement plans are projected here.
Let us go back to the tax input table. Again I will point out that the only required tax input one needs to make is to select your state from the pulldown menu. However, all of these categories of taxes and tax adjustments are available to you if one actually were to need to make changes. These sections also allow a person to to understand what is going on related to various taxes within VeriPlan.
Here are the federal income tax rates right now that are being used. If you scroll down a little bit more you will see that that there is no obsolescence built into VeriPlan. If you wanted to change the taxes over time or just play around with different tax rates, you can make the change here and then all you do is simply substitute a two for a one here. Then, VeriPlan would begin to use your modified tax rates instead.
If you scroll down a little bit further, these are the state tax rates that are supplied. As we see, this is for in New York State. Her are income tax rates for married filing jointly and here are state income tax rates for single taxpayers. Again, the same method that was used for federal income taxes will allow you to change the income taxes at the state level for any US state and the District of Columbia. Then, just switch between a 1 and a 2.
The next area is for local incom taxes. Some of you may not believe that there are local income taxes, bu there are many areas of the United States where you have to pay local income taxes as well. So, this is where you can choose the local income tax rates to use. You can fill them in right here, and then down here you can select them.
I have actually used a particular model for New York City. This particular couple doesn ‘t live in New York City but if they were to work in New York City, we simply could put in a 3 here. A carriage return makes the change and now their plan is using these New York City income tax rates for their lifetime projections. Let us just reset this back to a zero to remove the local income taxes from this VeriPlan projection.
The next section is for differences in taxable income. In certain states, if you pay attention to your income taxes, you will notice that when you compare the federal taxable income to state taxable income there ‘s a big difference in terms of what is taxable. If that is the situation for you, you can make an adjustment in this section here. You make the adjustment in which would set VeriPlan up to assess taxes on a proportional basis depending on how much taxable income you actually had between federal income taxes, state income taxes, and local income taxes.
The next section is for if you have additional personal exemptions and dependent deductions. You can enter them all here, and then they will be automatically projected throughout time frame down here. The next section is for when you expect regular tax adjustments.
The next section is for long-term federal itemized tax deductions. If you have certain long-term federal itemized tax deductions, you can enter them here. The thing by the way to note on deductions is that VeriPlan will automatically assess the better for you of either the standard deduction or itemized deductions. For example, if you have real estate tax deductions plus mortgage interest deductions, VeriPlan it will automatically assess the itemized deductions and will take this information into account if you added it here.
Moving on, this section is just information only on your total real estate tax payments. If we go back here to the Property and Debt worksheet, this is where you enter information including real estate taxes. Therefore, this part of the Taxes worksheet simply summarizes all your real estate tax inpute.
I believe I mentioned before that you can have rental properties in other sections of the Property and Debt worksheet. These sections down here are where you can enter rental properties. And, you can have other businesses as well. However, that functionality is for a more sophisticated model than we are doing right now.
The next section down here is for Social Security tax parameters. You would probably never have to change this because the tax rates are expected to say the same
This is for long-term capital gains tax rates. VeriPlan will automatically calculate and project long-term capital gains, when you dispose of assets. It will implement also the Net Investment Income Tax. You can read about the NIIT here to understand is better. However, that is all automated, as well.
In this sectio there is an exclusions on long term capital gains on the sale of a primary residence. If you sell your home this long term capital gains exclusion on your residence can be substantial. A single taxpayer may be able to use quarter-million-dollar exclusion and a married taxpayer, filing jointly, may be able to use a half-a-million-dollar exclusion.
So i can just quickly illustrate that built into VeriPlan’s real estate logic is the ability to plan the sale of a property sometime in the future. So let us just imagine that this couple decided they were going to sell their property 40 years from now. Assuming they will have two percent in sales costs, this will all be automatic.
If we look out at the projection, we should be clear on this would need a more sophisticated with other changes to the model that I am not making here with these quick changes. For example, if they are going to sell her house in 40 years, they are still going to need to live, so you would have to put in additional expenses on a yearly basis related to the rent that they would need to pay thereafter.
But just it just to see what happens here, let us just look at Total Assets graphic. All the sudden you see that 40 years out the real estate is gone and then their remaining assets jump up. If you remember they had a total $3 million in assets at age 100. Now the total is over $5 million. However that also doesn ‘t reflect the fact that throughout this period of time they would need to make other adjustments.
If we go back and actually look at the Personal Taxes graphic, you will see that the amount paid for long term capital gains is not very large. If they did not benefit from the capital gains exclusion, they would pay a lot more in long term capital gains taxes. VeriPlan automatically excluded the half a million dollar exclusion related to selling their primary residence.
To sum up, the VeriPlan financial planning application has very sophisticated internal tax projection logic. You do not have to rely on just some general average assumptions. You can be assured that whatever is being projected for your particular family’s financial affairs includes an underlying taxation model that is sophisticated. Therefore, you will get a much better understanding of what might happen related to taxes in the future.
Thank you for listening.