Long-term U.S. cash, bond, and stock asset class compounded returns
Many investors would like to have a better understanding of long-term historical investment returns, so that they can have a more realistic understanding of what investment returns might be in the future. This article informs interested investors about historical inflationary and real dollar returns for the primary U.S. cash, bond/fixed income, and stock/equity asset classes over the past eighty-five years.
In particular, I summarize compounded annual asset class growth rates that start the year before the 1929 stock market collapse, which of course led to the Great Depression. These cumulative annualized returns then continue through eight more decades of economic ups and downs to the end of 2013.
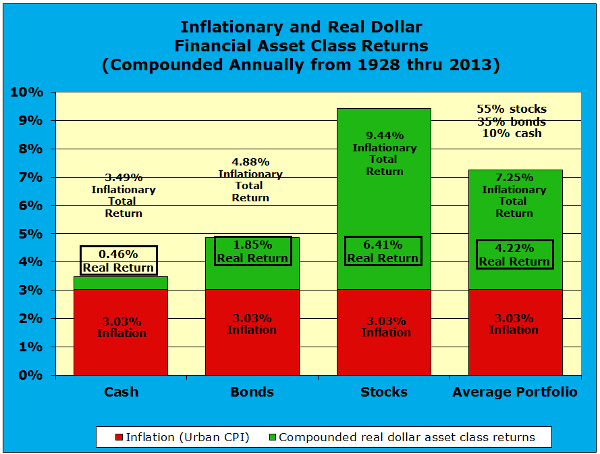
The chart below will aid in understanding this compounded annual investment returns data. It separates total compounded annual asset class returns into an inflationary return component and a real dollar return component for the cash bond, and stock asset classes.
In reality, all that should matter to investors is the real return on invested assets, because only real dollar appreciation increases portfolio purchasing power. The inflationary component is just a change in the unit of measurement and adds nothing to your financial welfare. All inflation does is to cut purchasing power and to degrade financial welfare — especially for those on fixed incomes without substantial investment assets that can appreciate.
This graphic also summarizes the total, inflationary, and real dollar compounded annual return for the average portfolio of the average investor. While there are variations across market cycles, the average investor portfolio normally holds about 55% stocks, 35% bonds, and 10% cash, when non-investment cash held for transactions and for short-term emergencies is not included.
Compounded annual inflationary, real, and total portfolio returns for the cash, bond, and stock asset classes
In this financial asset class returns chart, the first thing to notice is that the cash, bonds, and stocks asset classes all have the same compounded annual inflationary component. The long-term, eighty-five year compounded annual average for inflation or the change in the urban consumer price index (CPI) was very close to 3% or more precisely 3.03% per year from 1928 to 2013. While inflation is of course relevant to financial life and planning, it simply changes the value of a unit of currency over time.
It is always a good idea to extract inflation when evaluating investment performance. Inflation simply debases a currency, which obscures the true real dollar investment return. Investors should focus on the net real dollar return after excluding inflation, as well as investment fees, costs, and taxes. The net real dollar return is the only true measurement of changes in portfolio purchasing power.
Note that all columns in this chart provide three annualized compounded return measurements: a) total (inflationary) return, b) inflation, and c) real dollar return net of inflation. The compounded (or geometric) average for inflationary is always 3.03%. All columns include this 3.03% inflationary figure, so that it is easy to keep in mind how large inflation has been as a portion of total return.
Concerning cash returns over this long period, the total compounded annual inflationary return for cash has been 3.49% and the net real dollar return has been 0.46% annually. Some investors, who have not been working, saving, and investing for decades, might have difficulty believing that cash has had a slightly positive real dollar return over the long-term. In particular, since the financial crisis and the Great Recession of this past decade, savers have experienced almost zero inflationary dollar return on cash in money market funds and only a fraction one percent return on the typical savings account.
Since the financial crisis, real dollar cash returns have been negative. For example, while a tiny positive interest rate makes it appear like cash in a money market mutual fund has returned something in recent years, inflation has been about two percent since the financial crisis. Therefore, savers have been starting each year with a dollar and ending the year with about 98 cents after inflation. In contrast, older investors with longer experience can remember “five and a quarter percent passbook savings” and other times when interest rates did not hug 0%!


Moving on to bonds, which is the second column of the chart above, there has been real dollar return for bonds of about 1.85% per year without inflation. With inflation, bonds or fixed income assets have had a total compounded annual return over this 85-year period of 4.88%. To keep total bond returns in perspective, note that 3.03% compounded annual inflation means that of this 4.88% return, about five-eights or 62% of this total return was just due to inflation, which did not increase true wealth or purchasing power. (3.03% divided by 4.88% equals 62%)
Concerning the stock or equities asset class, which is the third column of the chart above, there has been long-term compounded real dollar return of about 6.41% per year without inflation. With inflation, equity assets have had a total compounded annual return of 9.44% over this 85-year period.
To keep total stock returns in perspective, note that 3.03% compounded annual inflation means that of this 9.44% return, about one-third or 32% of this total return was due to inflation (3.03% divided by 9.44% equals 32%). Therefore, in contrast to bonds, stocks had a significantly higher real dollar return and contributed far more to increasing purchasing power or wealth than did bonds or cash.
The fourth column in the graphic above introduces the weighted average compounded portfolio return for the average investor over this 85-year period. During the past fifteen years, the average portfolio of the average investor has held about 55% stocks, 35% bonds, and 10% cash, when cash for short-term emergencies and transactions is not included. Note that these percentages have fluctuated over the years as relative asset class values have varied across business cycles and securities market cycles.
Concerning this average investor’s buy-and-hold portfolio (gross returns without fees and taxes), the total compounded annual return has been 7.25% and the real dollar return has been 4.22%. With 3.03% compounded annual inflation, this means that of the 7.25% total blended portfolio return, about 42% of this total return was due to inflation (3.03% divided by 7.25% equals 42%).
Keep in mind that this is the gross annualized return on the original portfolio investment made in 1928 with no subsequent investment additions, except to reinvest any dividends paid out on holdings. No taxes or investment costs have been assessed in this calculation. Investment costs and taxes would have been substantial over this eighty-five year period. Very low cost, low turnover index fund investment products have only been available to retail investors during the past several decades. Furthermore, only during the past decade has the adoption of very low cost index investing really accelerated. More and more individual investors have finally realized that high investment expenses do not necessarily buy higher performance, but they are guaranteed to steadily erode net investment returns.
The author, Larry Russell, is a California independent investment adviser and financial planner and the developer of the VeriPlan lifetime and retirement financial planning software. A graduate of MIT, Brandeis, and Stanford, for over ten years Larry has developed turnkey comprehensive financial and investment plans and computer models for subsequent client low cost self-management. He focuses on helping people adopt the lowest cost investment posture using very broadly diversified index mutual funds and ETFs that track the market for a small fraction of what the typical investor pays.