
VeriPlan's personal financial planning software helps you understand your projected after tax lifetime income from multiple sources
VeriPlan's personal finance software projects each of your income sources separately. You can control the growth for any income source by setting annual growth rates that are below, above, or equal to the expected inflation rate.
VeriPlan is also a highly functional lifetime income tax estimator. VeriPlan automatically taxes your projected ordinary income at the U.S. federal income tax rates, state income tax rates, and local income tax levels, as appropriate, while it automatically takes into account your tax filing status, deductions, exemptions, and adjustments.
For example, these are the state income tax tables used by VeriPlan. You can select any state tax rates for your automated projections and also make adjustments, when tax rates change: State personal income tax rates in VeriPlan
VeriPlan's fully integrated future value calculator functionality automatically projects the real dollar value of your family's annual lifetime income in multiple categories, including:
1) normal earned employment income (wages, salary, bonuses, etc.)
2) working business owner income or self-employment income
3) pension and annuity income
4) Social Security income
5) other income, including income from alimony, rental real estate, royalties, trusts, and farm income
Do Your Own Lifetime Financial Planning Here
The VeriPlan's tax calculator functionality also automatically takes into account your capital gains tax distributions, property taxes, and other taxes.
VeriPlan's automated discounted cash flow analysis projects your future asset income and capital gains related to your cash, bond, stock, real estate, property, and other assets. VeriPlan automatically taxes your projected capital gains and asset withdrawals at the federal, state, and local long-term capital gains tax rates or ordinary income tax rates, as appropriate. Cash, bond, and stock assets are automatically withdrawn and taxed, if required, in years when you are projected to have a shortfall between your current income and current expenses. VeriPlan automatically invests any positive annual cash flow after taxes.
VeriPlan's pre- and post- retirement planning calculator features enable you to make annual positive and negative adjustments to your projected income. You can adjust your projected pre-retirement and post-retirement income at any age to reflect planned events, such as, unpaid sabbaticals, recurring or non-recurring bonuses, working part-time, expensive vacations, and other situations. You can also use VeriPlan's automated income adjustment facilities to test the impact of unplanned income disruptions, such as involuntary unemployment, during any year of your lifetime financial plan.
An example of VeriPlan's "1-INCOME" graphic: Gross Earned, Retirement, and Other Income (real $/yr)
Below is an example of the blue-tabbed 1-INCOME graphic, which comes from VeriPlan's "Sue and Sam Saver" tutorial, which is included on the VeriPlan CD. This graphic shows Sue and Sam's projected income, which is directly or indirectly associated with earned income sources and excludes income from their asset portfolio. Earned income for Earners #1 and #2 will also reflect any income adjustments made in the table in Section 4 of the '2-Your Earned Income' worksheet, which is entitled: "Making adjustments to your projected employment and actively-managed business income."
In this case, Sue and Sam are testing two adjustments to Sam's employment income. First, they project that he will be promoted in four years and receive a substantial real dollar raise. Second, they project that Sam will be unemployed for six months when he is 50 years old. The adjustments are just illustrations of your ability to adjust your income projection assumptions in VeriPlan for any or every year.
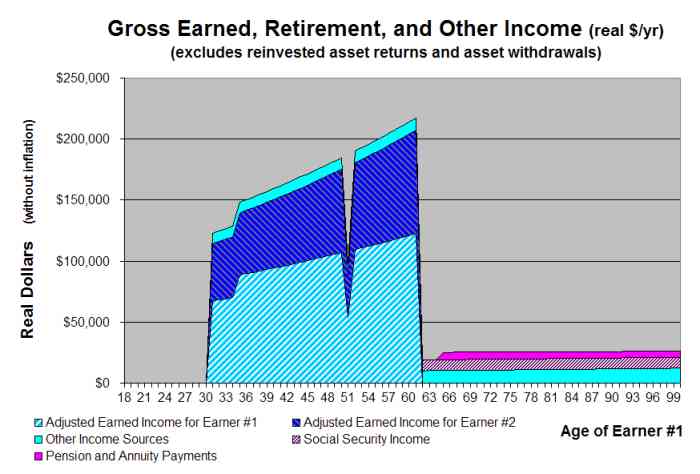
Each 1-INCOME graphic, which is automatically generated for every VeriPlan lifetime financial planning scenario, shows your:
* earned employment and actively-managed business income with your real dollar growth rates for Earners #1 and #2 that you entered on the yellow-tabbed '2-Your Earned Income' worksheet.
* the pension and annuity income for Earners #1 and #2 that you entered on the yellow-tabbed '3-Your Pensions & Annuities' worksheet
* the Social Security income with adjustments that you entered on the orange-tabbed '2-Retirement Tool' worksheet
* the "Other Income" that you entered on the yellow-tabbed '4-Your Other Income' worksheet
These income sources summarize your earned income sources and your non-asset related retirement income that is generally related to your earned income. Annuities are the exception in the sense that they sometimes represent assets that you have transformed into contractual income sources. Other annuities may be acquired without asset financial transformation through a regular, contractual purchase plan.
Some 'Other Income' sources may also be passive sources that do not require your active work to be received. These passive 'Other Income' sources are included primarily because they are listed as 'other income' on your tax returns, are taxed at ordinary income tax rates, and are grouped with your other more actively-earned 'other income' sources.
No income from assets nor any capital appreciation is represented on this graphic. Asset income is assumed to be taxed and reinvested. Assets are withdrawn only in years when you are projected to have a cash expense-to-earned income shortfall. VeriPlan automatically provides many other graphics and data tables that provide lifetime projection information related to your various assets.