A well-organized lifetime financial planning application with extensive color graphics
Organization:
The VeriPlan personal finance software provides thirty-four user accessible worksheets organized into groups that have the same colored tabs. VeriPlan provides extensive internal and external hyper-linking to help you to get around quickly. VeriPlan’s primary worksheet groupings and the number of worksheets in each group are:
- Information worksheets (2)
- User Profile and Tools input worksheets, including an overview (10)
- Central reference and links worksheets (1)
- Graphics worksheets, including an overview (20)
- Consolidated output data worksheet (1)
Financial Projection Graphics:
Each of VeriPlan’s twenty-one automated projection graphics covers ages 18 to 100 years in yearly increments. These lifecycle graphics automatically project your annual:
- Gross earned income, retirement income, and other income (real $/yr)
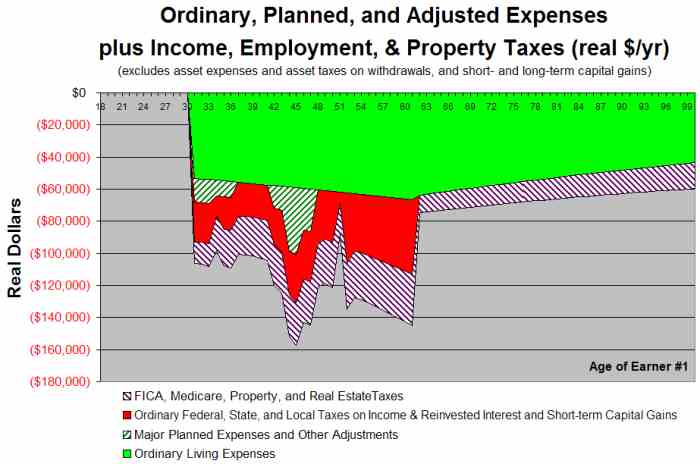
- Ordinary, major planned, and adjusted expense budget plus income taxes, employment taxes, & property taxes (real $/yr)
- Pre-debt profit, after expenses and taxes (real $/yr)
- Debt payments for consumption- and investment-oriented debt (real $/yr)
- Profit, after expense, tax, and debt payments (real $/yr)
- Pre- retirement savings rates — with and without investment-oriented debt payments (%/yr)
- Tax payments in eight categories (real $/yr)
- Average tax rates in eight categories, as a % of earned income, retirement income, and other income (%/yr)
- Gross and net human capital, which is your remaining ability to earn and save (real $/yr)
- Financial portfolio assets with net human capital (real $/yr)
- Financial portfolio asset allocation (%/yr)
- Net financial portfolio asset withdrawal rates (%/yr)
- Total assets with net human capital and debts (real $/yr)
- Taxable and tax-advantaged financial assets (real $/yr)
- Taxable and tax-advantaged financial asset deposit and withdrawal transactions (real $/yr)
- Pre-tax returns on cash, bond, and equity assets with excessive investment costs (real $/yr)
- Pre-tax returns on cash, bond, and equity assets with excessive investment costs (%/yr)
- Lost returns due to excessive past and future sales load payments (real $/yr)
- Cash, bond, and equity assets with cumulative assets lost to excessive investment costs (real $/yr)
- Financial, property, & other portfolio assets with cumulative assets lost to excessive investment costs (real $/yr)
- Asset portfolio “safety margin” (years going forward)
Projection Data:
The VeriPlan integrated financial calculator also automatically provides 21 data worksheets that provide tables with all the annual data that VeriPlan uses to draw each of its 21 projection graphics.
Constant purchasing power dollars:


All VeriPlan financial planning projections extract inflation and use real or non-inflationary dollars with constant projected purchasing power. By projecting and presenting all financial planning information in real, inflation adjusted dollars, in effect, the cost of a loaf of bread today is projected to be the same as the cost of a loaf of bread years or even decades into the future.
Planning applications with projections that include inflation force users to make mental adjustments for escalating cost-of-living, and this can be error-prone. VeriPlan projections are designed with real dollars to make analyzing the adequacy of future income and assets against projected expenses more straight-forward for the user.
This is an example of a lifetime living expense and taxes graphic that is automatically generated for every financial planning scenario that you develop in VeriPlan.